Gatus
Automated developer-oriented status page with alerting and incident support
サービス
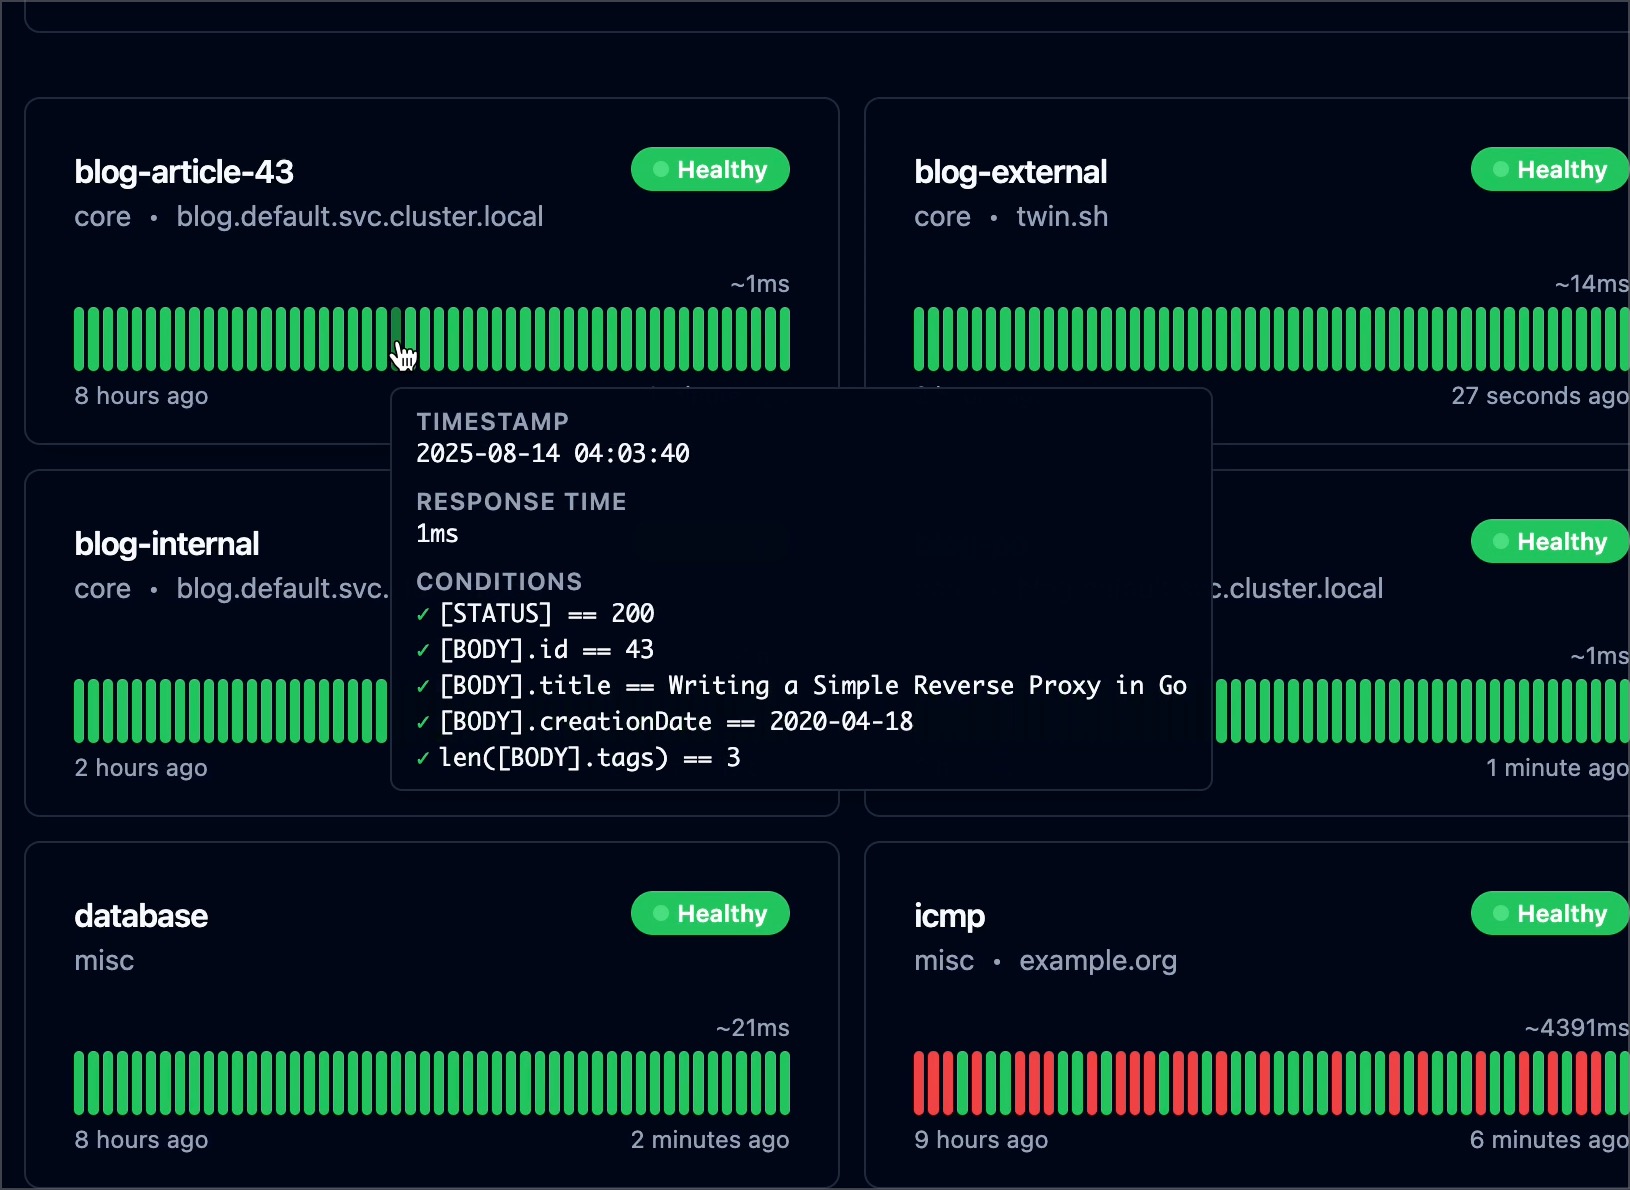
Gatus is a developer-oriented health dashboard that gives you the ability to monitor your services using HTTP, ICMP, TCP, and even DNS queries as well as evaluate the result of said queries by using a list of conditions on values like the status code, the response time, the certificate expiration, the body and many others. The icing on top is that each of these health checks can be paired with alerting via Slack, Teams, PagerDuty, Discord, Twilio and many more.
Usage
This is a one-click deployment template for Gatus. It enables SQLite for status persistence and the Metrics endpoint for Prometheus by default.
You should set the endpoints to monitor in the Config Editor.
For Gatus configuration documentation, please refer to their GitHub documentation.
Example: Monitoring HTTP endpoints
endpoints:
- name: backend-gateway
  url: "http://backend-gateway:80"
  conditions:
    - "[STATUS] == 200"
- name: backend-replica-1
  url: "http://backend-replica-1:8080"
  conditions:
    - "[STATUS] == 200"
- name: backend-replica-2
  url: "http://backend-replica-2:8080"
  conditions:
    - "[STATUS] == 200"
- name: backend-replica-3
  url: "http://backend-replica-3:8080"
  conditions:
    - "[STATUS] == 200"
Example: Monitoring with custom HTTP headers
endpoints:
- name: victoria-gateway
  url: "http://victoria-gateway:80"
  headers:
    # user:tNGeI87rzW27bwoeYFWQsfzO2Es9xCNc
    Authorization: "Basic dXNlcjp0TkdlSTg3cnpXMjdid29lWUZXUXNmek8yRXM5eENOYw=="
  conditions:
    - "[STATUS] == 200"
Example: Monitoring TCP endpoints
endpoints:
- name: postgresql
  url: "tcp://postgresql:5432"
  interval: 30s
  conditions:
    - "[CONNECTED] == true"
- name: redis
  url: "tcp://redis:6379"
  interval: 30s
  conditions:
    - "[CONNECTED] == true"