VictoriaMetrics
The high-performance, open source time series database & monitoring solution
Servicios
victoriametrics
victoriametrics/victoria-metrics:v1.137.0VictoriaMetrics is a fast and scalable open source time series database and monitoring solution that lets users build a monitoring platform without scalability issues and minimal operational burden.
It can store millions of data points per second on a single instance, or scale to a high-load monitoring system across multiple data centers. Also, it stores 10x more data using the same compute and storage resources as existing solutions.
Typically, you compose VictoriaMetrics with Grafana to visualize and integrate the metrics.
Check the benchmark between VictoriaMetrics and Prometheus on their blog. For more information about VictoriaMetrics, please refer to the official website.
Usage
You can find the port mapping (8428) from the “Networking” tab in the “Services” section.
To add your own targets, you should add them in the /etc/victoriametrics/scrape.yaml file on Config Editor. For example:
scrape_configs:
  - job_name: 'victoriametrics'
    static_configs:
      - targets: ['http://localhost:8428/metrics']
  - job_name: 'my-service'
    static_configs:
      - targets: ['http://my-service.zeabur.internal:8080/metrics']
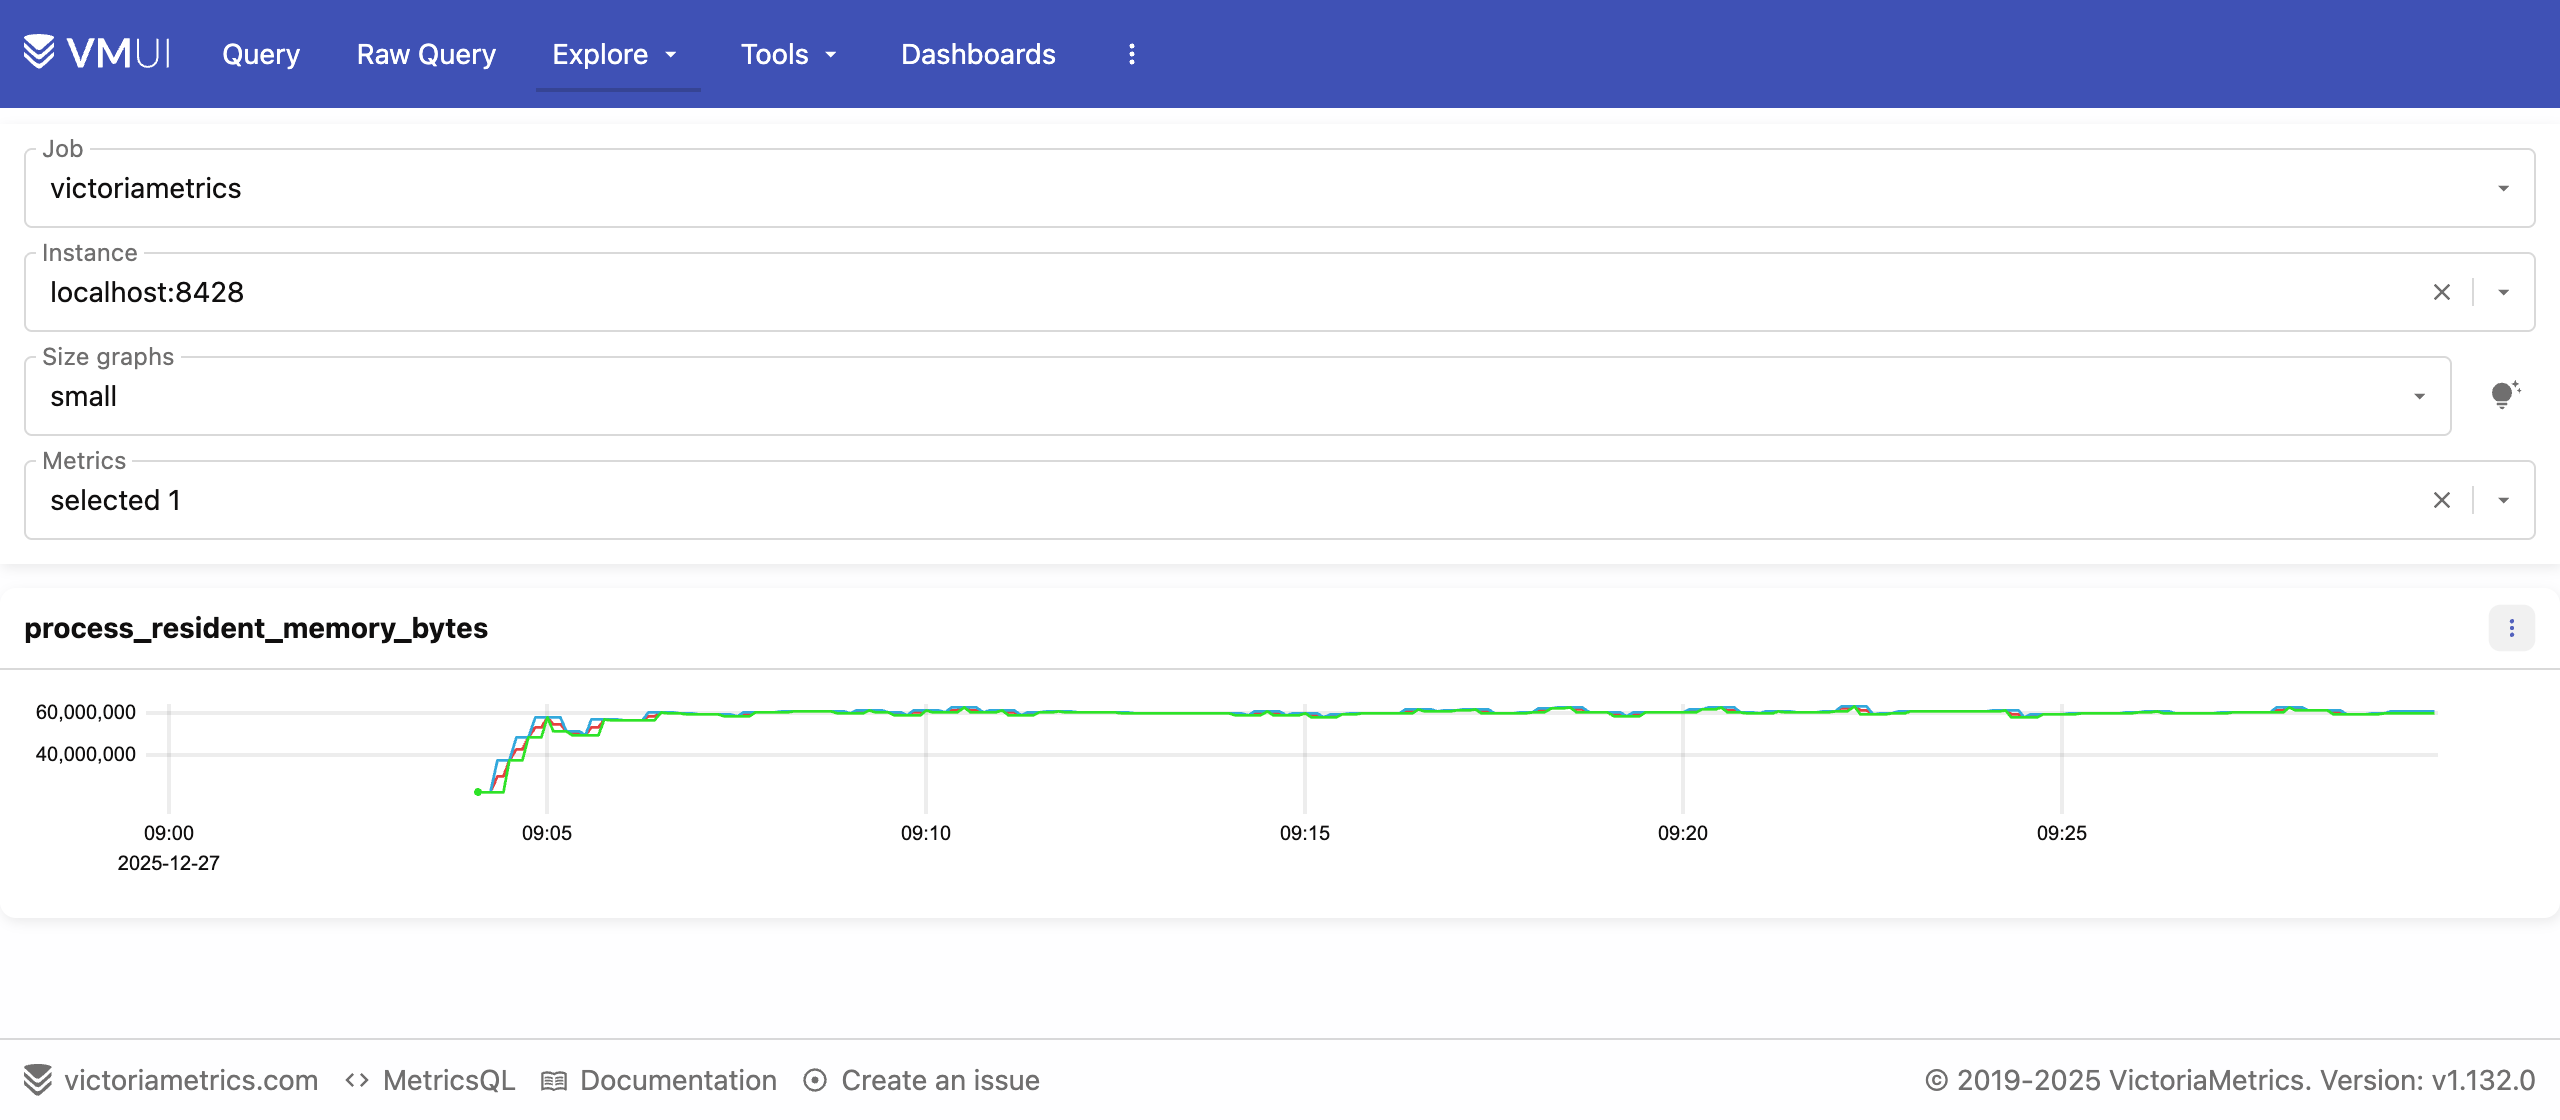
Then, you can query the metrics with VictoriaMetrics's Web UI at https://your-domain/vmui (where your-domain binds to the port 8428) and with Grafana.
By default, the data retention period is 30 days. You can change it by modifying the -retentionPeriod argument in the Command section of the Settings tab of this service. See Retention section in VictoriaMetrics' docs for more information.
More integrations supported by VictoriaMetrics are listed here.