Visual Analysis Tool Face-off: Rath vs Trifacta vs Power BI
 Yuhang
What is a visual analysis tool?
A visual analysis tool is a software or program that helps users analyze and interpret visual data or information. It allows users to explore and examine data through various visual representations, such as graphs, charts, and maps. These tools often come with features that aid in data filtering, sorting, and manipulation, enabling users to identify patterns, trends, and insights that may not be immediately apparent. The goal of a visual analysis tool is to make complex or large data sets more understandable and accessible to users by presenting it in a visually appealing and interactive format.
Why do we need visual analysis tool?
Visual analysis tools have become essential in helping individuals and organizations gain insights from complex and vast amounts of data efficiently, facilitate decision-making processes, and improve communication and collaboration.
Rath
RATH is not just an open-source alternative to Data Analysis and Visualization tools such as Tableau, but it automates your Exploratory Data Analysis workflow with an Augmented Analytic engine by discovering patterns, insights, causals and presents those insights with powerful auto-generated multi-dimensional data visualization.
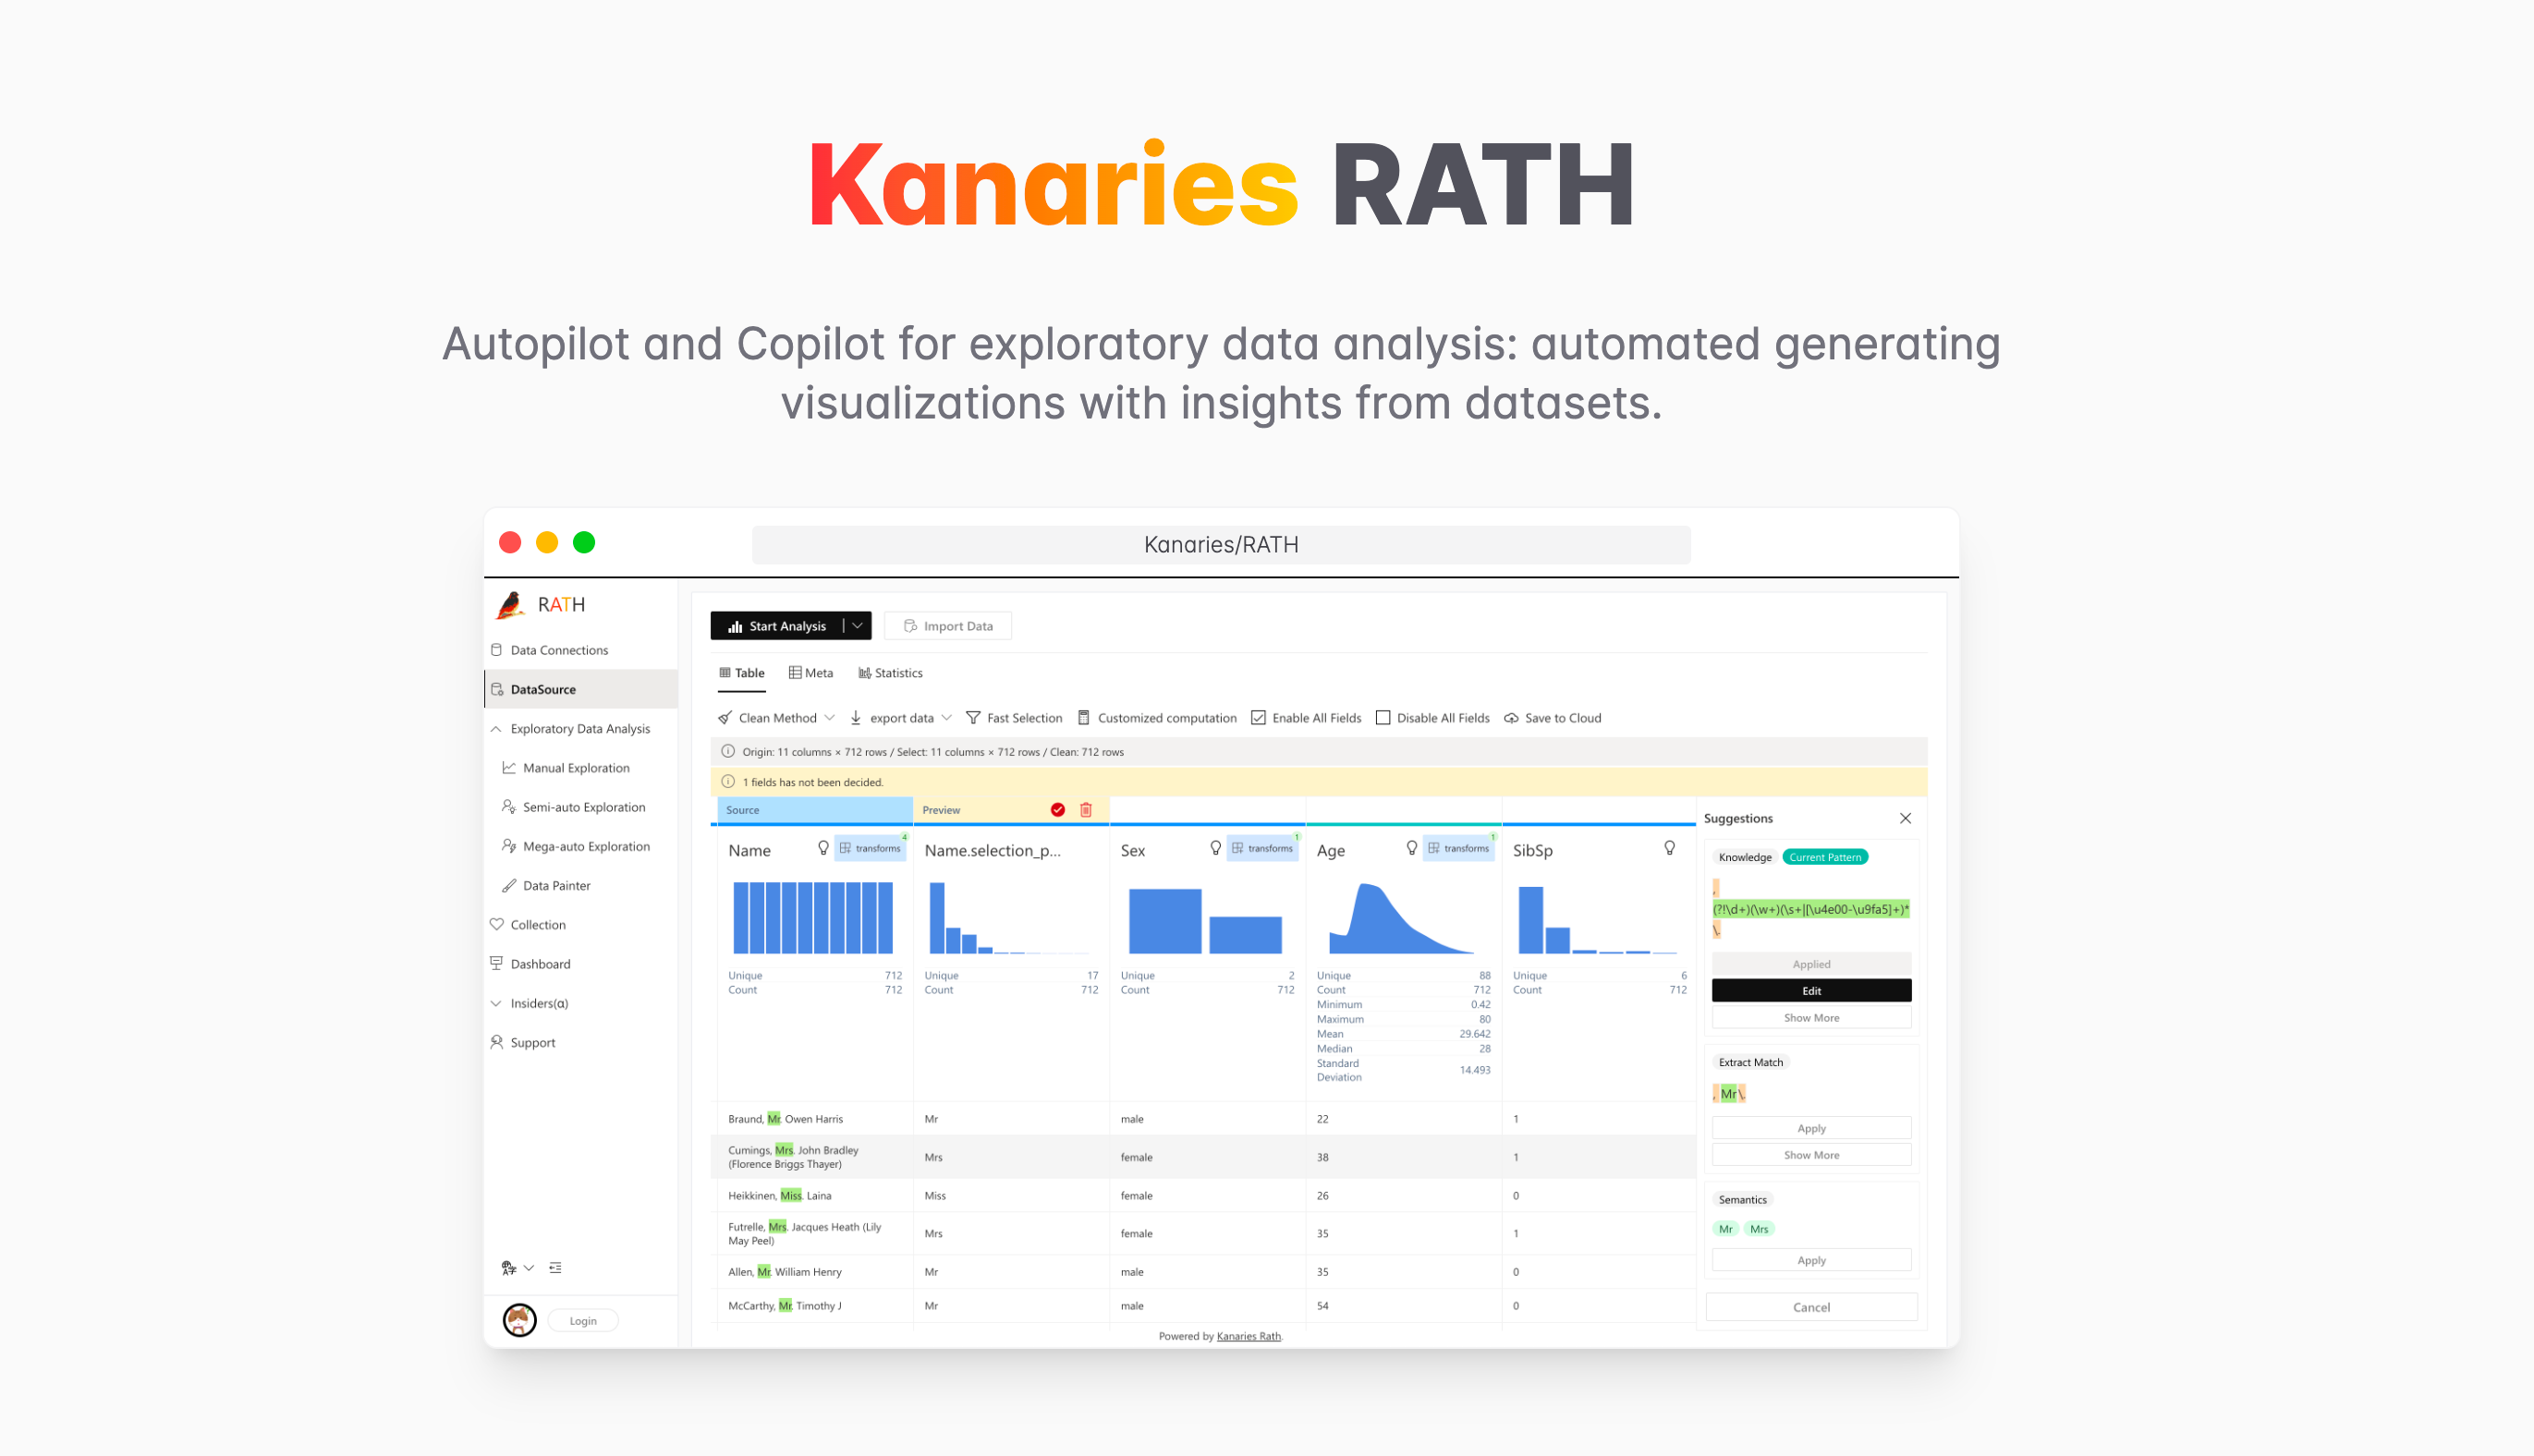
Benefits of Rath
-
Open-Source: Rath is fully open-source. So it’s freely to use and to be modified to meet specific needs.
-
AI-Powered: Rath provides a fully-automated way to explore and visualize dataset easily with AI empowered. It can work as your copilot in data science.
-
User Friendly Interface: Rath has a user friendly interface as a web application. Directly coloring your data makes your data analysis more easily and intersting.
-
Talk with Your Data: Rath also provides an option to let you talk to your data with natural language. You can simply talk to your data to get the analysis results.
Trifacta
Trifacta is "designed for analysts to explore, transform, and enrich raw data into clean and structured formats." Trifacta utilizes techniques in machine learning, data visualization, human-computer interaction, and parallel processing so non-technical users can work with large datasets.
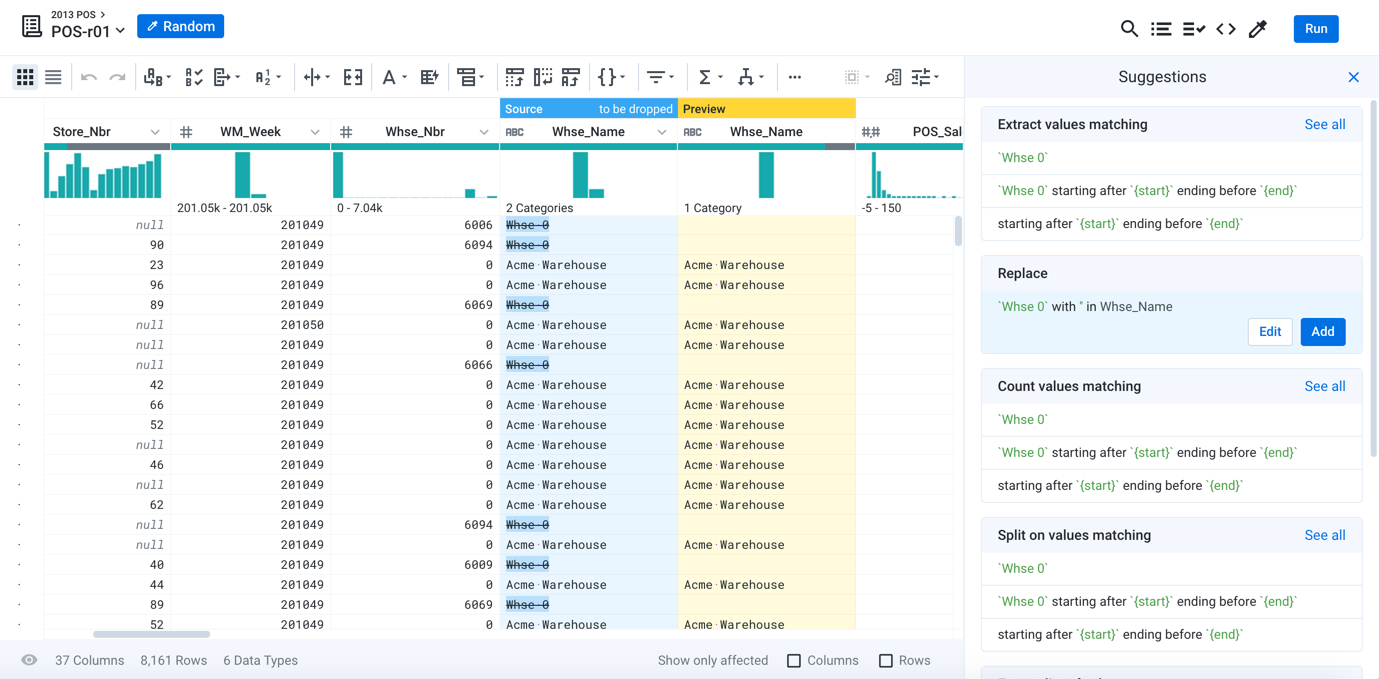
Benefits
-
UI/UX: Trifacta provides a super fun drag and drop experience.
-
Data Prep for All: Data wrangling allows all users within an organization to explore and prepare the data. This means the subject matter experts, regardless of data architecture level, will be able to work directly with the data and transform it into the right form.
Power BI
Power BI is a business intelligence platform from Microsoft. It offers data analytics tools and services for visualizing data, creating dashboards, and sharing insights. It allows users to connect to multiple data sources, clean and transform data, create custom calculations, and visualize data through charts, graphs, and tables.
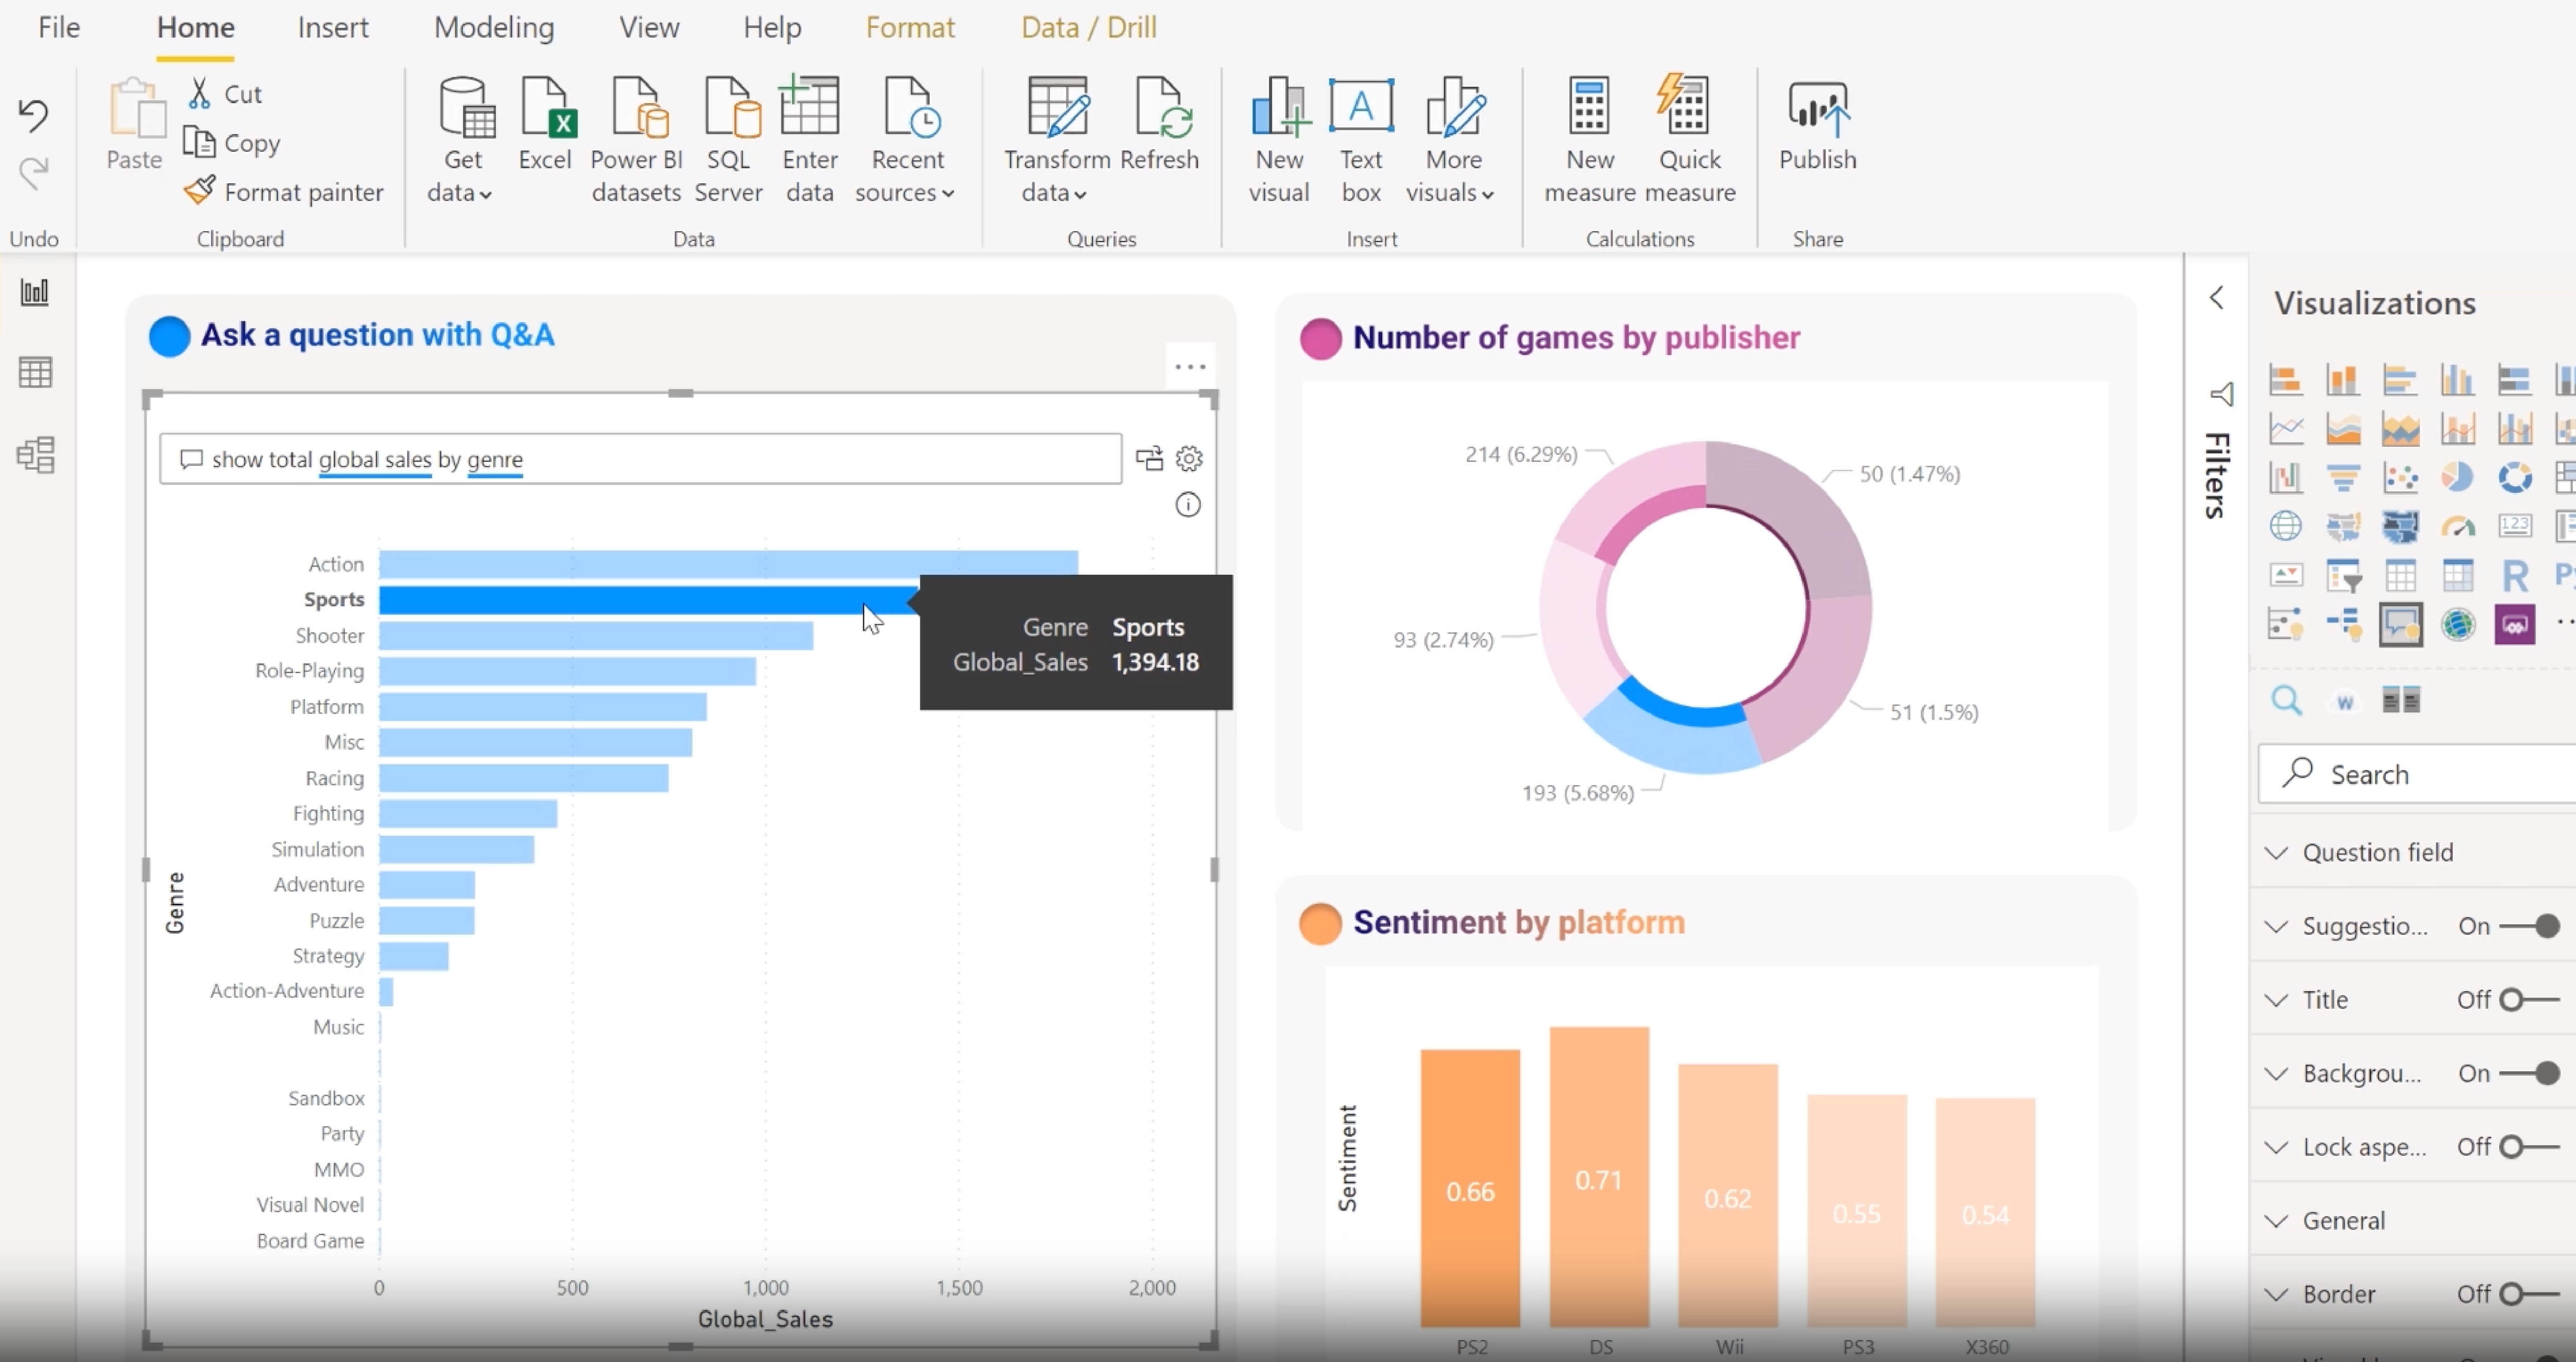
Benefits
-
Data Modeling: Power BI enables users to create and manage relationships between different data sources, define calculations, and develop measures and KPIs.
-
Collaboration: Power BI allows users to share and collaborate on reports and dashboards with colleagues and integrate with other Microsoft tools like Excel, SharePoint, and Teams.
Conclusion
AI tools such as GitHub Copilot and ChatGPT have the amazing capability to empower people and transform them into developers. This democratization of development means that anyone, regardless of prior coding experience, can now participate and contribute to the world of software development.
Similarly, the integration of AI capabilities into data visualization tools has the potential to make data science accessible to a wider audience. With data visualization tools powered by AI, individuals can easily transform raw data into visually appealing and meaningful representations. Individuals without extensive data analysis skills can leverage AI-powered tools to uncover patterns, trends, and valuable information hidden within their data.
As an Autopilot for exploratory data analysis, Rath is a cutting-edge data analysis tool that was among the pioneers in integrating artificial intelligence into its functionality. For people without any prior data analysis experience, Rath can be their AI assistant for automated generating visualizations with insights from datasets. Every one can be a data scientist with Rath’s supports.