
Glances
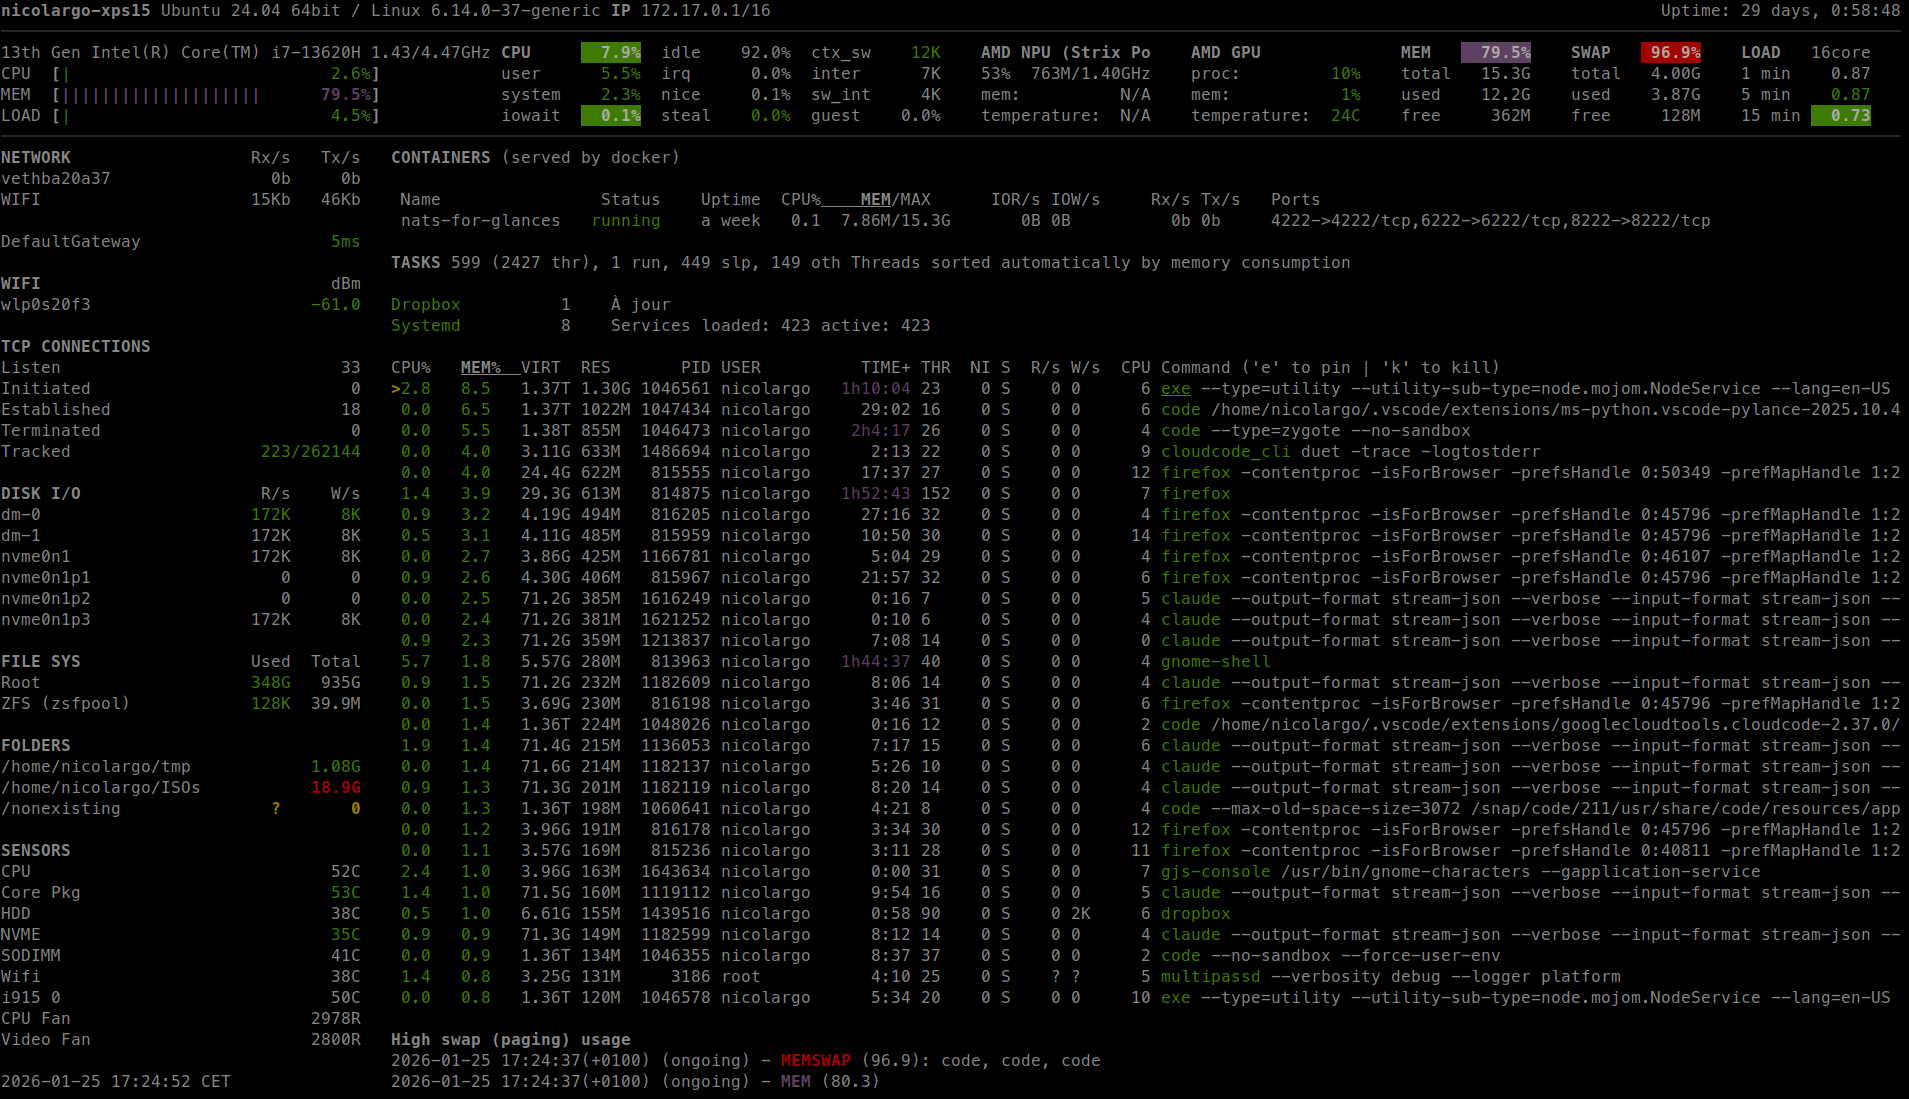
Glances is an open-source, cross-platform system monitoring tool written in Python. It provides real-time metrics for CPU, memory, disk, network, processes, and more through a responsive web UI — all in a single container with no database required.
Services
glances
nicolargo/glances:4.5.2-fullGlances
A cross-platform system monitoring tool that gives you a real-time overview of your server through a clean web interface.
What You Can Do After Deployment
- Visit your domain — Glances loads immediately, showing live system metrics
- Monitor CPU & Memory — view real-time usage, load averages, and per-core stats
- Track Disk & Network — see I/O rates, mount points, and network interface throughput
- Inspect Processes — sort running processes by CPU, memory, or I/O usage
- Use the API — access metrics programmatically via the built-in REST API:
https://your-domain/api/4/quicklook— system overview (CPU, memory at a glance)https://your-domain/api/4/cpu— detailed CPU statshttps://your-domain/api/4/mem— memory usagehttps://your-domain/api/4/pluginslist— list all available API endpoints
Key Features
- Real-time Metrics — CPU, memory, swap, disk, network, sensors, and more
- Responsive Web UI — works on desktop and mobile browsers
- REST API — all metrics available as JSON for integration with other tools
- Process Monitoring — detailed per-process resource usage
- Alerts — configurable thresholds with color-coded warnings
- Plugin System — extensible with additional monitoring modules
- Low Overhead — lightweight Python process with minimal resource usage
License
LGPL-3.0 — GitHub
Services