Grafana
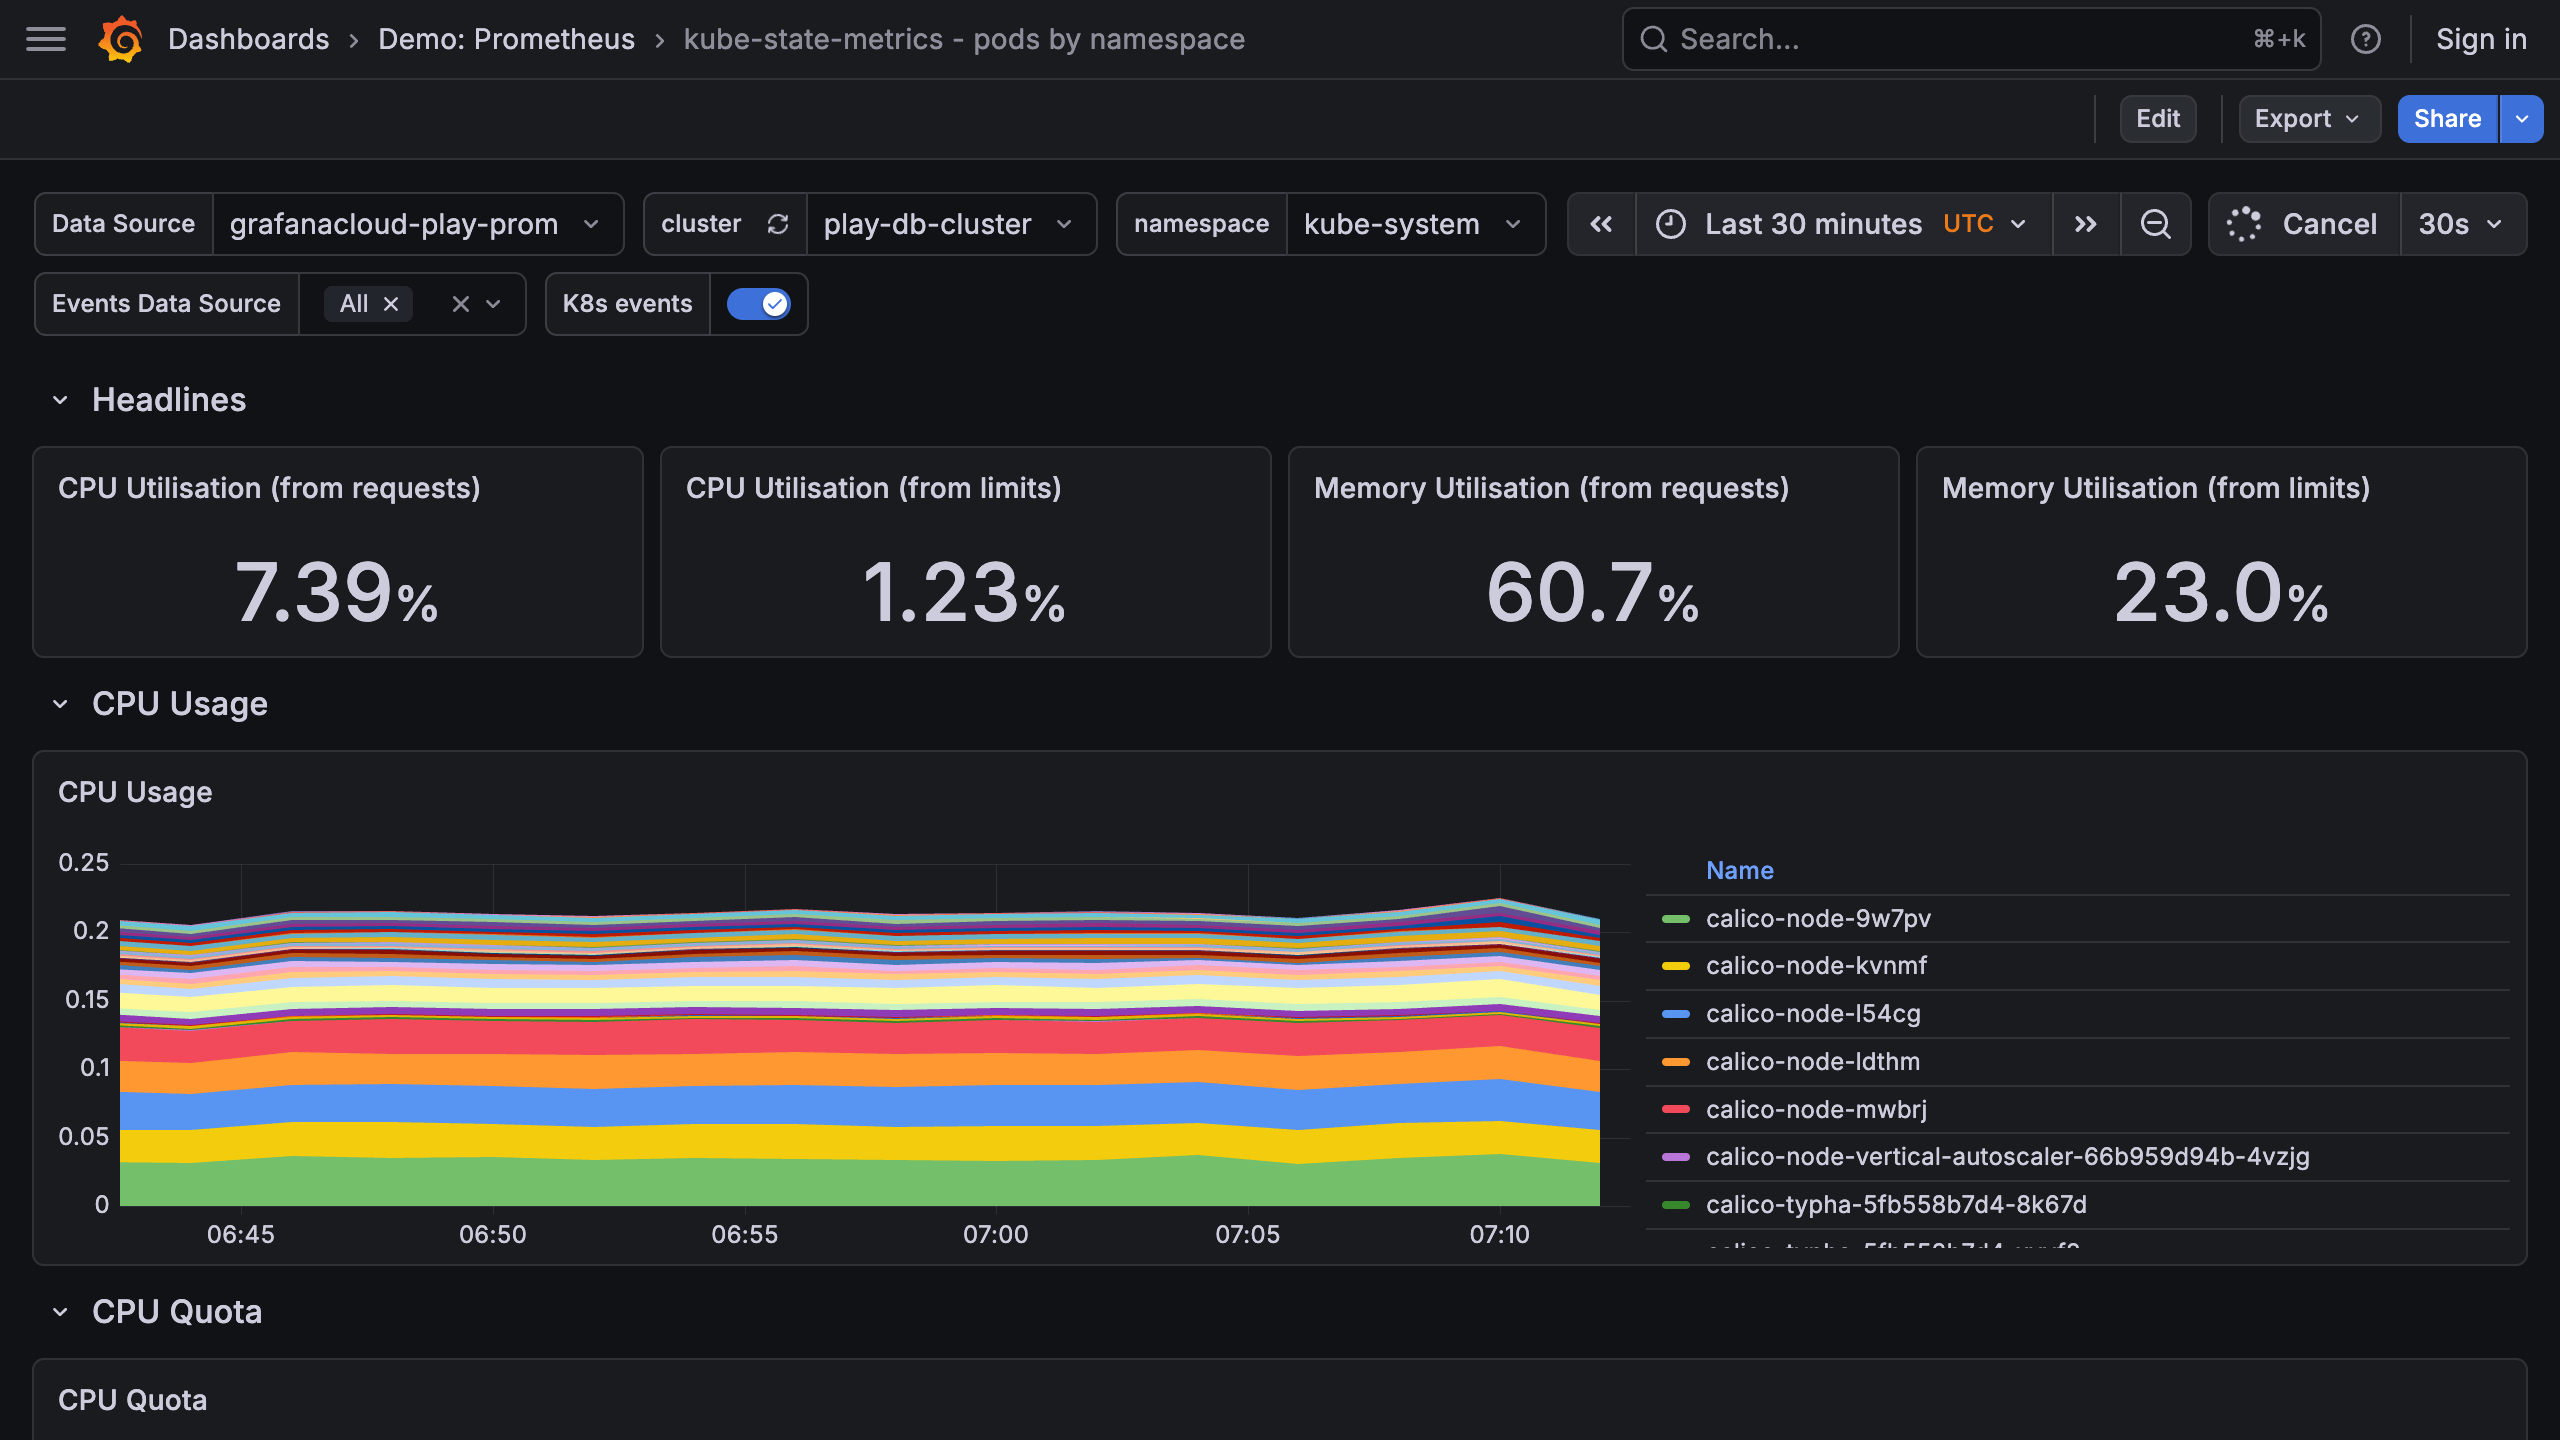
Grafana is the open source analytics & monitoring solution for every database.

Servicios
Grafana is the open source analytics & monitoring solution for every database.
Usage
It is a one-click deployment of Grafana.
You specify the domain to access your Grafana dashboard, and the admin user to access the Grafana dashboard. Password will be generated automatically.
Integrations
To achieve a comprehensive telemetry solution, you may need additional metrics backends. Several useful Zeabur one-click templates comprise the tracing, metrics, and logs trio:
- Metrics
- Tracing
- Logs
You may also want to use OpenTelemetry Collector for VictoriaMetrics to collect metrics from your services and send them to your backends centrally.
Cross-project solution
If your Grafana is not in the same project as the metrics backends, you may need to connect them via a public network.
Solutions like HAProxy, Caddy, and NGINX can help you set up basic authentication for your backend, ensuring that unauthorized users cannot access your metrics.
If you are using VictoriaMetrics Stack, we have an out-of-the-box solution based on Caddy for you.